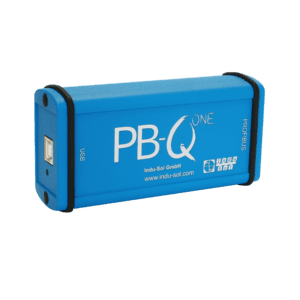
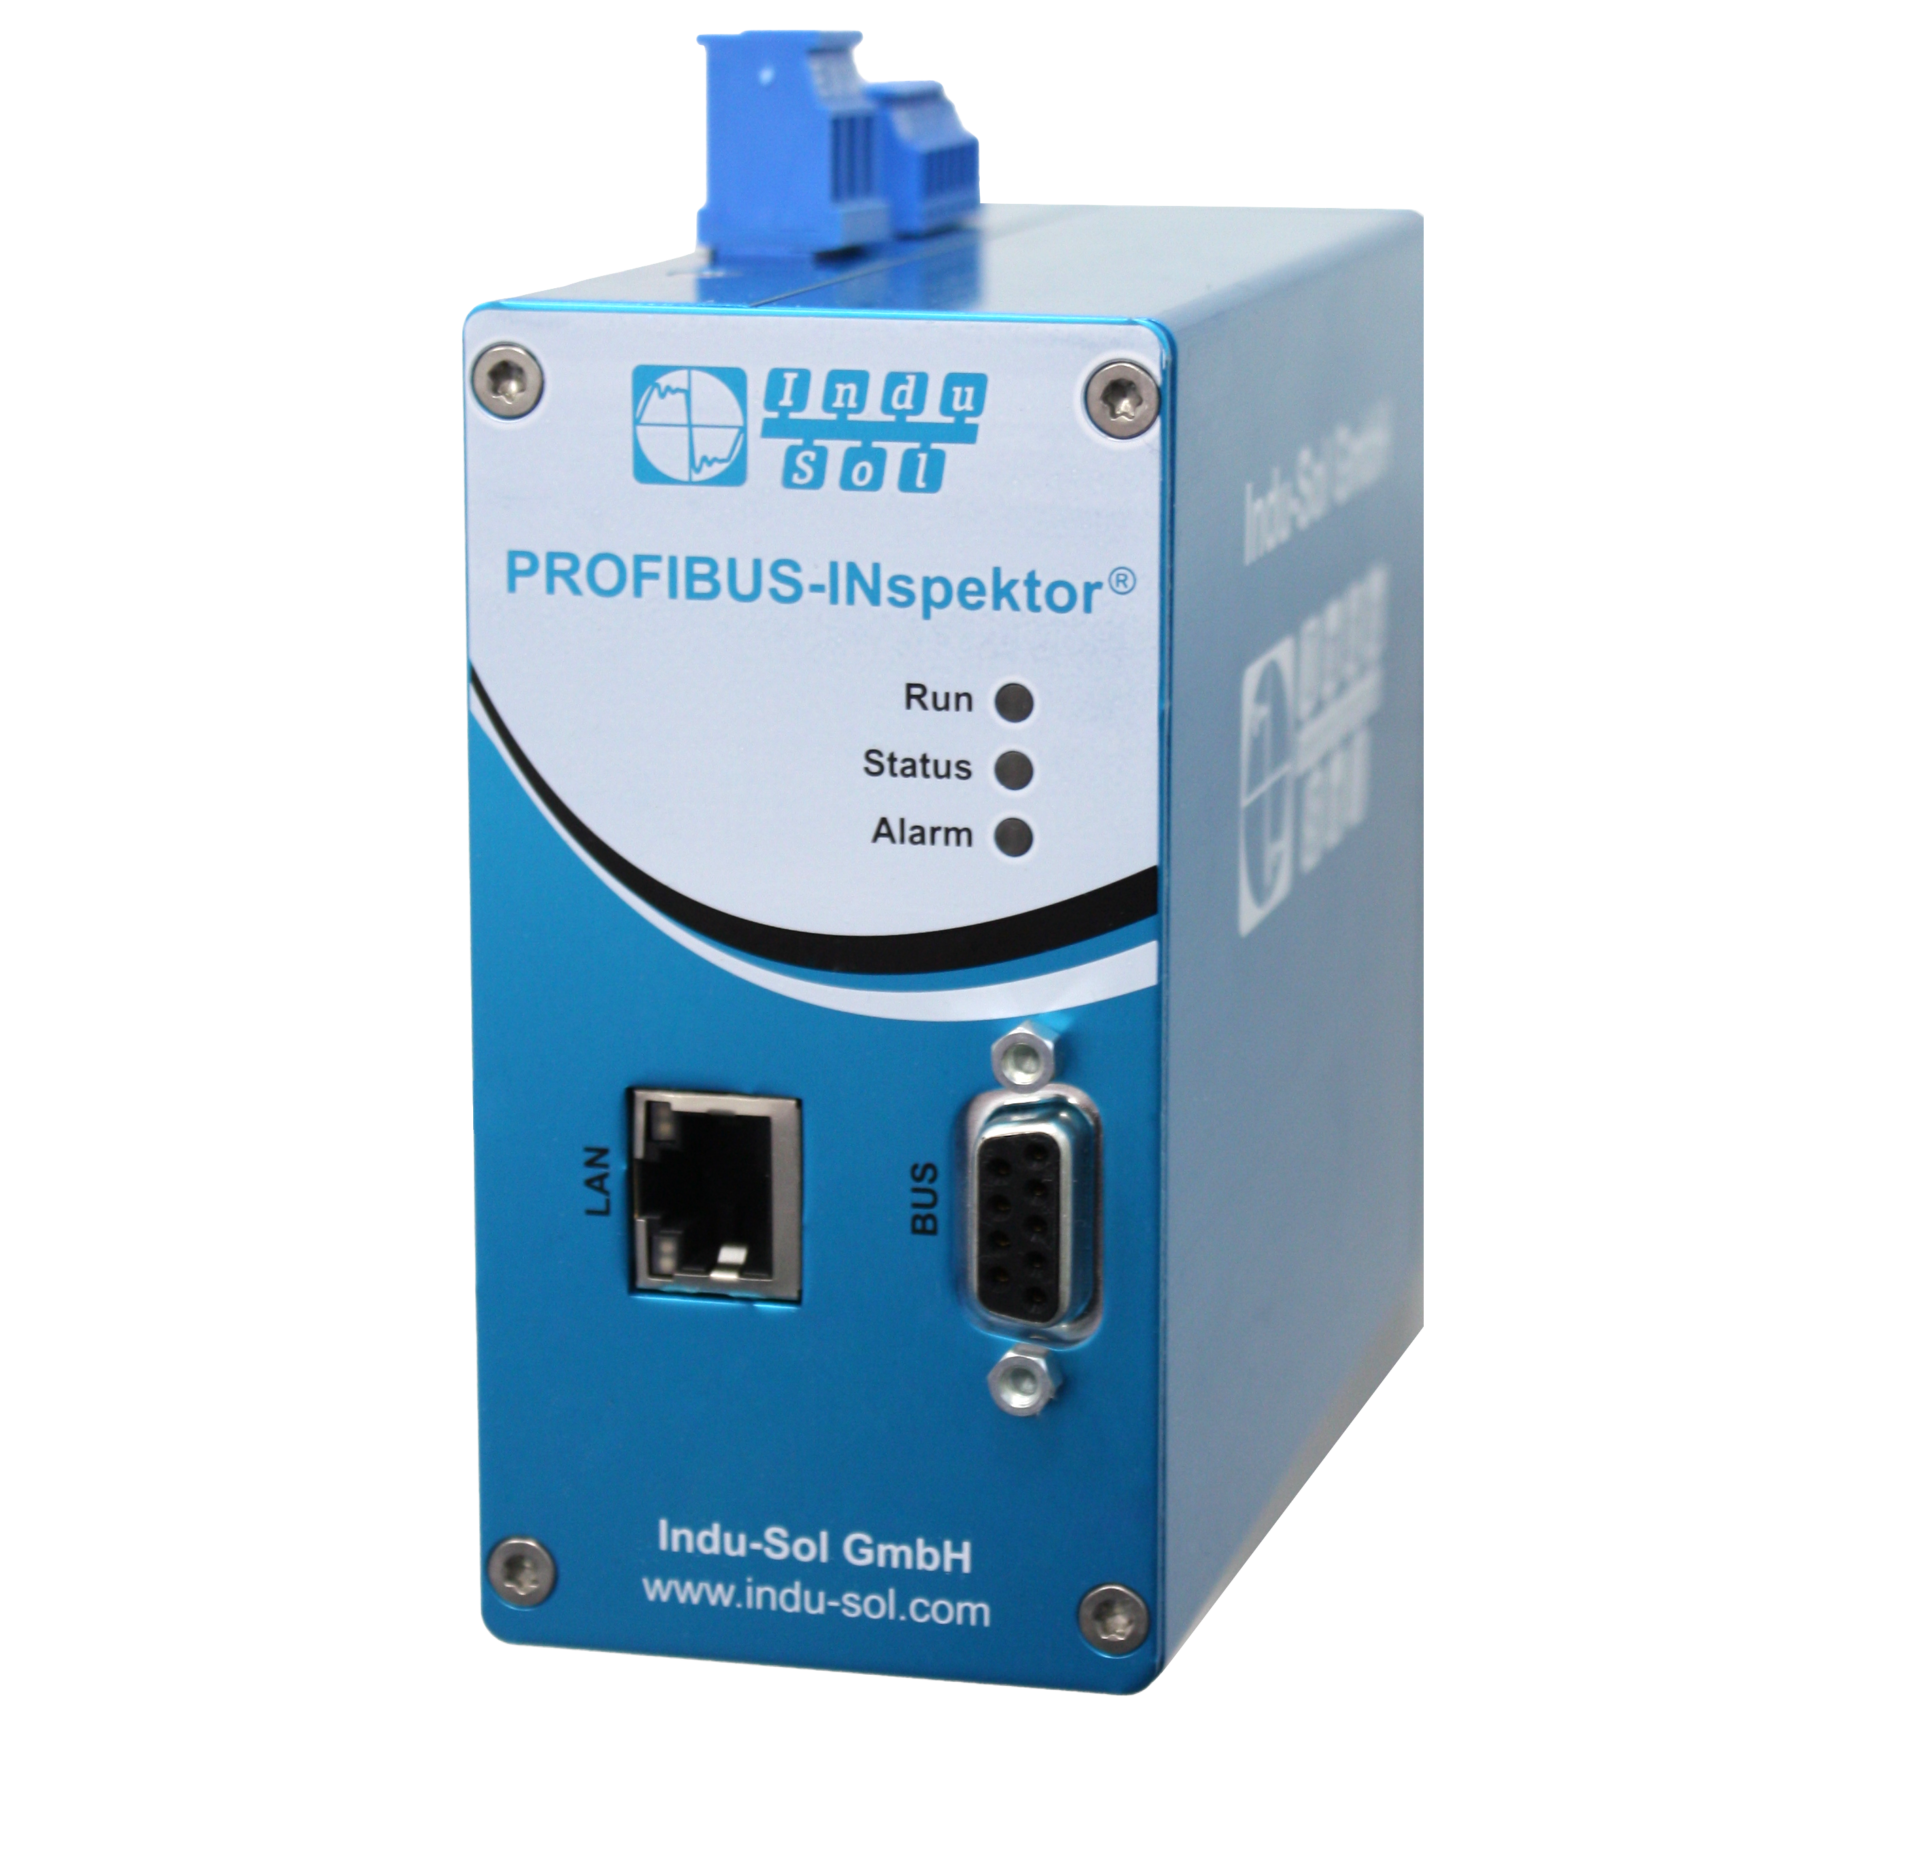

PROFIBUS-INspektor® NT
Item #124010020 – PROFIBUS-INspektor® NT | PROFIBUS DP condition monitoring tool
-
- Logging of events with time stamp for easy review
- Life cycle of your network and the current fieldbus condition at a glance
- Alerting via switching contact, LED display or email alert
- Topology with status display for quick error localization in network
- Automatically generated inspection report with all important event details
- Web interface for acceptance report and a network overview (Pdf)
PROFIBUS Inspektors Monitor the Logical Data Exchange
Interruption-free reading of all data
No additional software is required for reading the data from the PROFIBUS-INspektor® NT. You only need an Internet browser (e.g. Mozilla Firefox) to access the web interface integrated in the device. This allows you to view both the current network status and a history of past events.
Note: The web interface of PROFIBUS-INspektor® NT can be accessed conveniently via the web browser of the connected device (e.g. notebook or tablet) – without any additional software required. No active Internet connection is required.
Topology function with status information
Error statistics with detailed timeline
You can clearly see which device is most frequently affected by the events that have occurred (e.g. telegram repetitions). This provides you important information for troubleshooting.
Automatic alerts for PROFIBUS errors
By accessing the web interface of PROFIBUS-INspektor® NT, a detailed alarm list shows which error occurred on which device along with a time stamp. In addition, it records which event (threshold value) triggered the alarm. The internal memory allows to record up to 2000 alarm messages, and each alarm is assigned to a snapshot with up to 1000 PROFIBUS telegrams.
Alert options
► E-Mail (Push) ► LED indicator
► SNMP-Trap ► switch contact
Easy creation of a PROFIBUS acceptance log
The PROFIBUS-INspektor® NT offers you the possibility to create a complete acceptance log of your PROFIBUS project, with just a few clicks and in a short time. It contains all important information on the respective PROFIBUS system, from topology to bus-related EMC conditions.
The simple start for permanent network monitoring
With PROFIBUS-INspektor® NT, you can easily get started with permanent network monitoring. The compact INspektor® is the simplest solution of a decentralized data collector for PROFIBUS networks. Without any special configuration effort the device is immediately ready for use to record all characteristic logical quality parameters in your PROFIBUS project. Based on this, you can maintain and service your PROFIBUS system on demand. Reduce maintenance costs and efforts with permanent PROFIBUS monitoring by using the INspektor® NT by Indu-Sol.
PDF Data Sheet